|
The December quarterlies for the Australian industry showed the gold companies delivered strong evidence of operational improvement, excellent cash operating margins, builds in cash and also exploration success in extending existing mineralised zones and finding new. Mine life expectations are being extended. Earnings reports are also coming through with big gains and more dividends.
Gold production in 2016 reached a 19 year high of 298 tonnes and should make a new record high in 2018.

The sector is doing well and is awaiting the coming pick up in the gold price that will push valuations higher to test 2016 highs and the XGD.ASX to move above 6000.

The cash builds and operating earnings are very likely to provide reported earnings improvements throughout the Gold Sector and with resulting higher tax payments by the sector we can expect more and higher franked dividends. NST, EVN, RRL and RSG are leading. Note RRL already has a 57% payout ratio for its interim dividend. As industry capex flattens and more debt is repaid most gold producing stocks will be providing >60% payout ratios.
Dividend flows will also push sector valuations higher and the point is reiterated that gold stocks will be better dividend payers than bank stocks.
There is much to like about these gold companies and their managements who are already industry experienced technicians and who are now starting to learn about corporate future strategies rather than just survival.
The operating ratios on ore yields, productivity and gold recoveries continue to improve and the competition amongst Australian industry players is healthy and beneficial.
The geological assessments seem to be entering a new stage with sub pit discoveries, down plunge extensions and intersections along new splays featuring in almost every quarterly. There is nothing like large positive cashflows to assist management give the geology department funding for resource extension and new target testing.
The Zuleika Shear near and west of Kalgoorlie continues to impress with Northern Star kicking goals everywhere there (watch here and watch for mid year resource upgrades) and Evolution finding tantalizing evidence of additional sub parallel shears east of the important high grade K2 Structure for Frog’s Legs. Resource and production upgrades are coming here to what is currently the most exciting goldfield on the world.
St Barbara, Saracen and Ramelius are also adding ounces with their efforts in WA. US-based Newmont is doing well in the Tanami and NST is upscaling its interests there.
Newcrest now has operations running at full capacity and Westgold out of MetalsEx is hitting 300kozpa. Smaller companies like Blackham and Pantoro are growing very nicely.
The strength in copper (note the recent breakout in price and also it is outperforming gold) will be very good for Newcrest, OceanaGold and Evolution with their gold/copper operations that are already reporting negative gold production costs through copper by-product revenues.
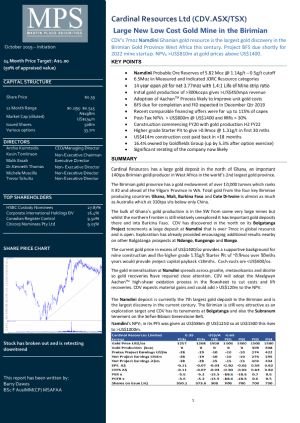
Site visits last month to Stonewall’s elephant (just how big is this going to be?) in South Africa and Cardinal’s growing Namdini resource in Ghana (far longer intersections (25-50m) than most Birimian gold mines in Ghana/Cote D’ivoire) confirm excellent potential for their shareholders.
As noted, there is much to like in all these stocks and choosing the best plays is challenging.
The performance since 1 Jan 2017 of some these stocks has been impressive with @DawesPoints favourites recovering well after the broad decline in the Dec Half of 2016.
Westgold did best of the ASX Gold Index group with late comers Resolute and Ramelius starring and low cost St Barbara also performing. Regis did well and Northern Star is still very cheap.
Beadell is consolidating and might just be offering something special there in Brazil. A$51m in a recent equity raising supports this. Let’s watch Beadell and the conceptual continental drift link to the gold deposits across the Atlantic in Ghana and Cote d’Ivoire. Most intriguing.

Source: Beadell Ltd
Amongst the non XGD gold stocks, Cardinal, Blackham, Pantoro and Gascoyne have done well and Torian will have the outstanding potential in its Zuleika Shear projects recognised soon. Tyranna is also continuing to build resources on its Sth Australian tenements and getting better every quarter.
Note again the Dec Half 2016 relative strength of Westgold, Resolute, Ramelius and Silverlake in the XGD and Cardinal, Blackham, Stonewall and Ark Mines in the Non-XGD.
Stocks that outperform in down markets often have superior strength in the next upleg.

Dawes Points Gold Portfolios Performances
(nontrading portfolios with stocks selection purchased on given dates)
Dec 2014 Portfolio + 227 % vs XGD +181.6 %
Jan 2016 Portfolio +98.3% vs XGD + 81.1%
Dec 2016 Portfolio +18.0% vs XGD + 21.3%
Gold stocks with Australian operations have generally still been outperforming those in the ASX XGD with overseas operations.
The weaker A$ has helped to some degree by providing positive cashflows but as the A$ gold price has been reasonably steady for the past five years it has been better managers and better ore bodies that have proven the difference.
Note that the A$ gold price has had a nice A$110/oz upward kick to A$1,640 from near A$1,525 on the lower trend channel and is heading toward the mid channel at just above A$1,900. The top channel is around A$3,000.
This sector can only get better!


Australian gold production is good and stock performance has been strong. In contrast, companies with overseas operations having high cost mines, poor operating regimes and debt have meant that many of the stocks have continued to underperform. However, the leverage in these is high and will come with a rising US$ gold price but care needs to be taken on stock selection so choose well.
Only Perseus, Beadell and Oceanagold seem attractive here. Resolute was a later addition to the XGD so did not make this index series.
Most visible public commentary from the bigger brokers and investment banks today is suggesting ASX gold stocks are currently fully valued and most public valuations seem to be pitched within 10% of current prices with very few outliers. The `consensus’ is that these are fully valued and so are `sells’. This lack of conviction for a higher future gold price seems strange.
Similar comments are being made about BHP, RIO and FMG. All `fully valued’ by the major brokers and investment banks despite the now-excellent balance sheets, strong cash flows and surging dividends at the start of a decade long bull market in the main commodities of iron ore, copper, coking coal and oil.
Aren’t US investment banks wonderful!
This is in strong contrast to Dawes Points. My commodity and stock price targets are far beyond current prices and much higher for much longer.
With firm prices expected for iron ore (the Dawes Points US$95 mid year target came four months early), copper and oil over the next few years, more appropriate end 2018 targets are BHP A$36, RIO A$90 and FMG A$11.
The Dawes Points 2016 July General Resources portfolio is up 33.5% vs XMM 30.4%.
The Gold Market
Gold seems to be re energizing for another upmove with a break through US$1250 and on to challenge the previous near term highs above US$1360. The 2016 breakout above US$1250 to around US$1375 has pulled back nicely to test the downtrend for a `Good Bye Kiss’ and is now looking ready to move up gain.
This trend break and the decline back to the breakout line for the Good Bye Kiss is notable in many of these metals markets so the probabilities are high for an upmove soon.

The gold market action is being supported by a strong move in silver where a break through US$18 is suggesting all metals are moving. The `Good Bye Kiss’ test for silver has already been successful and silver can now rally further to US$21 and higher than that should bring rapid follow through.

Palladium and platinum are looking very positive and copper has already broken out in what should be a very strong move.
Palladium looks very strong. >70% production from Russia. Platinum has >70% from Sth Africa
 
Copper – Short term is very strong. Long term is >US$5/lb.
 
All these moves have been clearly signalled in Dawes Points for quite some time and they all indicate tight markets where demand is robust and supply is restrained. LME inventories are still critically low.
Negative sentiment expressed through the futures markets has affected prices but this has only made metals cheaper for the natural buyer.
When the sentiment turns there will substantial short covering and then natural buying will propel most metals prices much higher.
Silver and copper are giving important BUY signals against gold. Trend breaks and Good Bye Kisses abound.
 
General commodities are bottoming and a big rally is developing.

Seasonal influences may influence prices in the short term but the power will soon be unstoppable.
Gold demand is still, in my view, mostly about the relentless demand from Asia and the Middle East (with the notable addition of 900m people from Africa hopping on board too) that is tightening the market in the West. This firm Asian demand is absorbing loose gold from weak hands and the usual superficial issues of global debt, US$ value, bond prices, banking system collapses and inflation are coming but aren’t quite with us yet.
This growth in share of Global GDP and hence growing wealth is important to appreciate in understanding demand for gold. China is huge, India is the key market but ASEAN is wealthier than India. Africa is rising and better commodity prices for gold, copper and oil will boost growth further.
Share of Global Wealth (39%) or Global population (58%). Shares are rising in both.


The period since the 1990s is of great importance in economic history as it brings in the rising living standards of great populations of this world for the first time.
Firstly the 400m in ASEAN (expanded to 650-700m with the inclusion of Vietnam and Myanmar) then almost 1400m in China, and now India (1300m) and with Africa with its 900m and growing GDP bringing it together.
Whether you look at population or GDP the numbers are still growing for people who want higher living standards.
In the US itself the economy continues to improve and higher Fed Funds Rate levels are inevitable and bullish for gold. And negative for T Bonds and the US$.
The US economy seems very robust with housing leading but still playing catch up with a large inventory deficit of as much as 4 years demand. Housing sector stocks are breaking to new 11 year highs.
 
And these new generation basic industries- Microsoft and Amazon - are in strong uptrends.
 
And the US banking sector is loving it.
 
US inflation picking up again and circulation of money is gaining - Federal Reserve Bank of St Louis
 
President Trump’s actions are interesting and unpredictable but so are the responses from the broad cabal of vested interests relying on receipt of public sector funding that is financed through the bond markets at today’s low interest rates as discussed here previously. This public sector largesse on cheap money is coming to an end. This cabal of related interests is fighting a tough rearguard action though.
As to the impact of US politics on the gold market it is difficult to say. What way and how will the US T-Bond market be affected and hence what will be the direction of the US$? The expected oversold bounce rally in US T-Bonds has not yet eventuated so it may just be a matter of further weakness ahead in both US bonds and currency.
A near term rally here to test the US$1360 level for gold will probably bring a pull back for a month or so but then, going forward, gold might be very strong in the Dec Half of 2017.
Here, moves above US$1360 then US$1400 should give probabilities of US$1550 being tested, then US$1750 and then reaching the old high of US$1923 from Sept 2011.
Above that, who knows, but once any of these levels are breached it could be quite a quick move.
The battle between buyers and sellers has been robust and drawn out for the past four years but the character of the market is suggesting a quick resolution might apply once US$1360 is exceeded as noted above.
Gold has been fighting in this tight US$250-300 range for almost four years. Resolution and defeat for one side of the market should mean a strong move in favour of the other. I favour the longs!

The gold stocks are looking very firm and here on ASX and the North American XAU is moving higher after a good pullback.

whilst GDX, the Van Eyk ETF, is under heavy accumulation.
GDX ETF - under accumulation

Gold stocks will be outperforming gold for quite some time yet.

And Gold Stocks outperforming general stocks for a long time too!

This is all good news for gold share owners and for owners of all resources shares.
The Road Map for the next few years is becoming increasingly clear and the global reluctance to invest in the Resources Sector is being tested daily.
The opportunities are enormous and the cash on the sidelines in Australia was A$1870bn at last available data in Sept Qtr 2016*.
Don’t miss out.
Call or email me to join in this vast wealth making wave ascending beneath us.
bdawes@mpsecurities.com.au and +61-2-9222-9111.
(*Data now no longer available from the RBA – is the RBA also part of the cabal – increasing salaries but shedding workers and cutting services?)
I may own or control in portfolios all the stocks mentioned in this report.
Barry Dawes
@DawesPoints #62
|
 Martin Place Securities is Australia's Boutique Resources Investment Firm, specialising in emerging mining, resources and energy companies.


