China CleanTech Index 2Q13 Quarterly Performance Report
Sydney, July 10, 2013 AEST (ABN Newswire) - The China CleanTech Index provides the definitive measure of the performance of Chinese cleantech companies that are listed on stock exchanges around the world.
The cleantech industry is split into a number of sub-sectors as detailed in the table below. Each of the sub-sectors contains companies that have both environmental and economic benefits.
-------------------------------------------Sub Sectors-------------------------------------------BiogasGeothermal - Hot dry rocks and conventionalBiofuelsLow Emissions Transport TechnologiesCarbon TradingSolar Thermal and PhotovoltaicsEnergy Efficiency & BiomaterialsWaste Management & RecyclingEnergy Storage & Fuel CellsWaterEnvironmental ServicesWave, Tidal & HydroGreen BuildingsWind Generation-------------------------------------------
The cleantech sector is fundamentally different to Socially Responsible Investments (SRI) or Environmental, Social and Governance (ESG) performance. SRI and ESG look at incremental improvements in company performance and can be seen as 'operational hygiene' measures that find the best in class. Cleantech focuses on companies whose output positively enhances the communities and ecologies in which they reside. It is about doing 'more good' rather than 'less bad'.
With 150 companies falling under the coverage of the Index and with a combined market capitalisation of nearly 800 billion Renminbi (US$126 billion), the China CleanTech Index presents for the first time a picture of the Chinese cleantech industry's growth in a single measure.
The Index is weighted by market capitalisation and is benchmarked against the following indices to show its relative performance:
- Wilder Hill New Energy Global Innovation Index (NEX) - which measures the performance of global clean energy stocks
- Cleantech Index (CTIUS) - which measures the performance of global cleantech stocks
- China Shanghai Composite Index (SHCOMP) - which measures the performance of stocks listed in Shanghai.
- MSCI World (MSCI) - which provides a measure of the performance of global stock markets.
The rules for the formulation and management of the Index have been developed with reference to global best practice. An overview of these rules is provided in the Index Launch report.
The China Cleantech Index is updated each month and published on the SinoCleantech website at www.sinocleantech.com and on the Australian CleanTech website at www.auscleantech.com.au. It is published internationally in conjunction with Cleantech Investor (www.cleantechinvestor.com) and in China in conjunction with Top Capital (www.topcapital.cn).
Monthly results can be emailed directly to interested parties by subscribing at www.sinocleantech.com.
China CleanTech Index Performance
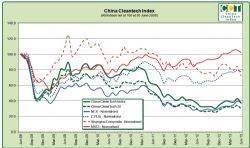
The China CleanTech Index underperformed all but one of its benchmarks for the month of June 2013.
The China CleanTech Index fell from 42.7 to 37.0 over the month of June recording a 13.4% loss. This compared to the NEX loss of 0.3%, the CTIUS loss of 3.3%, the Shanghai Composite loss of 14.0% and the MSCI loss of 2.6%. The China CleanTech 20 fared slightly better with a loss of 12.3%.
Over the second quarter of 2013, the China CleanTech Index recorded a loss of 4.7%, underperforming all the benchmark indices other than the Shanghai Composite. Over the quarter, the NEX gained 13.6%, the CTIUS lost 0.5%, the Shanghai Composite lost 11.5% and the MSCI lost 0.1%.
Over the first half of 2013, the China CleanTech Index recorded a gain of 7.7%, outperforming both the Shanghai Composite and the MSCI World Index. Over the half, the NEX gained 24.4%, the CTIUS gained 10.0%, the Shanghai Composite lost 12.8% and the MSCI gained 7.1%.
--------------------------------------------------------Percentage Change 2009 2010 2011 2012 --------------------------------------------------------China CleanTech Index 77.5% -9.6% -48.0% -16.5% China CleanTech 20 59.6% -15.6% -47.4% -15.5% NEX 39.7% -14.6% -40.2% -5.5% CTIUS 38.1% 7.3% -18.3% 7.3% Shanghai Composite 80.0% -14.3% -21.7% 3.2% MSCI 27.0% 9.6% -7.6% 13.2% ----------------------------------------------------------------------------------------------------------------Percentage Change Jun'13 2Q13 1H13 12 Mths 3 Yrs--------------------------------------------------------China CleanTech Index -13.4% -4.7% 7.7% 0.8% -47.3%China CleanTech 20 -12.3% -6.8% 6.9% 0.9% -49.7%NEX -5.0% 13.6% 24.4% 29.7% -17.7%CTIUS -3.3% -0.5% 10.0% 20.2% 20.3%Shanghai Composite -14.0% -11.5% -12.8% -11.1% -17.5%MSCI -2.6% -0.1% 7.1% 16.0% 36.8%--------------------------------------------------------
The market capitalisation of the 150 stocks in the China CleanTech Index is RMB 767 billion (US$123 billion), before its rebalance, falling from its peak of RMB 911 billion in February 2011 but up from its trough of RMB 604 billion in November 2012.
Best and Worst Stocks
The best and worst performers in terms of share price performance over the month, the second quarter of 2013 and the first half of 2013 are shown in the table below.
Over the month, 8 companies recorded share price gains of more than 20%, with four of these being solar companies, and 9 companies recorded losses of more than 30%.
Over the quarter, 14 companies recorded share price gains of more than 40%, 11 of these being solar companies, and 9 companies recorded losses of more than 40%.
Over the last six months, 16 companies recorded share price gains of more than 60%, 7 of these being solar companies, and 8 companies recorded losses of more than 40%.
June 2013
------------------------------------
Best Performers
Share Price Gain > 20%
SmartHeat Inc
Canadian Solar Inc
Daqo New Energy Corp.
Hanwha Solarone Co Ltd
Shunfeng Photovoltaic International
China Ritar Power Corp.
China Sun Group High Tech Co.
China Recycling Energy Corp.
Worst Performers
Share Price Loss > 30%
Beijing SPC Environment Protection Tech Co., Ltd.
Fujian Longking Co., Ltd
Hunan Yonker Environ Protection Co Ltd
Hunan Corun New Energy Co., Ltd.
Tianneng Power International Limited
Jiangsu Welle Environmetnal Co., Ltd.
Shanghai Canature Environmental Products Co
Jiangsu Jixin Wind Energy
Sinovel Wind Group Company Limited
------------------------------------
Second Quarter 2013
------------------------------------
Best Performers
Share Price Gain > 40%
Canadian Solar Inc
China Solar Energy Holdings Limited
China Sunergy
Hanwha Solarone Co Ltd
JA Solar Holdings
JinkoSolar Holding Co., Ltd.
ReneSola Ltd. (ADR)
Sungrow Power Supply Co
Suntech Power Holdings
Trina Solar
Yingli Green Energy
EVE
Beijing Water Business Doctor Co., Ltd.
China Ming Yang Wind Power Group Ltd
Worst Performers
Share Price Loss > 40%
Shenzhen Refond Optoelectronics Co Ltd
Bodisen Biotech, Inc.
Tianneng Power International Limited
Zhejiang Narada Power Source Co., Ltd.
Jiangsu Welle Environmetnal Co., Ltd.
Chengdu Xingrong Investment Co.,Ltd
Shanghai Safbon Water Service Co
Jiangsu Jixin Wind Energy
Titan Wind Energy (suzhou) Co Ltd
------------------------------------
First Half 2013
------------------------------------
Best Performers
Share Price Gain > 60%
Hanwei Energy Services
Shantou Wanshun Package Material Co., Ltd.
Canadian Solar Inc
China Solar & Clean Energy Solns., Inc.
China Solar Energy Holdings Limited
Hanwha Solarone Co Ltd
JA Solar Holdings
Shunfeng Photovoltaic International
Sungrow Power Supply Co
EVE
Shenzen Desay Battery Technology Co., Ltd.
Beijing Water Business Doctor Co., Ltd.
Duoyuan Global Water
Tianjin Capital Environmental Protection Group Co., Ltd.
China Datang Corp Renewable Power Co Ltd
Huaneng Renewables Corp Ltd
Worst Performers
Share Price Loss > 40%
ZJ Fuchunjiang Environ Thermoelectric
Shenzhen Sunwin Intelligent Co., Ltd.
Shanghai Chaori Solar Energy Science
China Sun Group High Tech Co.
Zhejiang Narada Power Source Co., Ltd.
Shanghai Safbon Water Service Co
Jiangsu Jixin Wind Energy
Titan Wind Energy (Suzhou) Co Ltd
------------------------------------
Index Rebalance
The China CleanTech Index underwent its quarterly rebalancing at the end of June which took account of recent share issues and other corporate activity.
There were no changes to the index constituents this quarter.
Component Sub-Indices
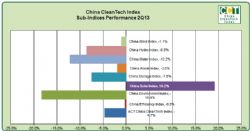
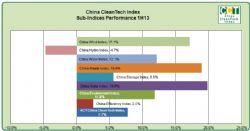
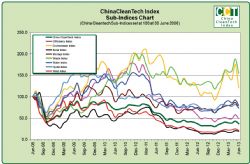
To provide an analysis of the China CleanTech Index, eight sub-indices have been developed. The performance of each of these sub-indices over the last four years is and the current quarter are shown in the table and charts below.
All but one of the sub-indices recorded losses for the quarter. The only sub-index that had a positive result for the three months to June 2013 was the China Solar Index that recorded a 19.2% gain. The next best result was the 0.3% loss for the China Efficiency Index. The worst performers were the China Environment Index with a loss of 18.4% and the China Water Index recording a 12.2% loss.
The story over the first half of the year has been very different. Only one of the eight indices, the China Hydro Index, recorded a loss with solid gains from the others. The best performing sectors were the China Solar Index with a 19.8% gain followed by the China Waste Index with an 18.9% gain. The worst performers were the China Hydro Index with a 4.7% loss and the China Efficiency Index with a 2.5% gain.
----------------------------------------------------------------China CleanTech Sub-Indices----------------------------------------------------------------China Efficiency Index 102.4% 31.8% -60.4% -30.9% -0.3% 2.5%China Environment Index 157.4% 13.5% -31.1% -21.8% -18.4% 11.8%China Solar Index 92.4% -13.0% -57.5% -36.2% 19.2% 19.8%China Storage Index 141.0% -15.1% -36.6% 11.7% -7.5% 5.6%China Waste Index 65.7% 99.1% -25.9% -12.5% -2.0% 18.9%China Water Index 113.5% 9.6% -49.7% -8.0% -12.2% 12.1%China Hydro Index 78.9% -35.6% -23.0% 1.1% -8.6% -4.7%China Wind Index 45.8% -21.0% -57.7% -32.5% -1.1% 17.1%----------------------------------------------------------------
Index Component Companies
The 20 largest Index constituents by market capitalisation on 30 June 2013 are provided in the table below. These stocks will be the constituents of the China CleanTech 20 until the Index rebalance on 30 September 2013.
In the China CleanTech 20, the greatest sub-sector representations are Water with seven companies followed by Wind with five companies.
New entrants to this list at this rebalance are Shanghai Aero Auto Electromechanical, after only three months out of the list, JA Solar Holdings and Beijing Water Business Doctor. These have taken the place of Beijing SJ Environmental Protection and New Material Co, Zhongshan Public Utilities Group and Chengdu Xingrong Investment Co.
---------------------------------------------------------------Company Sector Exchange Code---------------------------------------------------------------1 China Yangtze WAVE, TIDAL Power Co., Ltd. HYDRO Shanghai ( SHA:600900)2 China Longyuan Power Group Corp WIND HKSE (
 HKG:0916) 3 Sinohydro Group Ltd WAVE, TIDAL HYDRO Shanghai (
 SHA:601669)4 Chongqing Water Group Company Limited WATER Shanghai (
 SHA:601158)5 Beijing Originwater Technology Co., Ltd. WATER Shenzhen (
 SHE:300070)6 Sound Environmental Resources Co., Ltd. WASTE Shenzhen (
 SHE:000826)7 GCL-Poly Energy Holdings SOLAR HKSE (
 HKG:3800)8 Huaneng Renewables Corp Ltd WIND HKSE (
 HKG:0958) 9 China Everbright International WATER HKSE (
 HKG:0257) 10 Sinovel Wind Group Company Limited WIND Shanghai (
 SHA:601558) 11 Beijing Enterprises Water Group WATER HKSE (
 HKG:0371) 12 Xinjiang Goldwind Science & Technology Co. WIND Shenzhen (
 SHE:002202)13 Beijing Capital Co., Ltd. WATER Shanghai (
 SHA:600008) 14 Tsinghua Tongfang ENERGY EFFICIENCY Co., Ltd. & BIOMATERIALS Shanghai (
 SHA:600100)15 Tianjin Capital Environmental Protection Group Co., Ltd. WATER Shanghai (
 SHA:600874)16 Beijing New Building Materials Public GREEN Limited Company BUILDINGS Shenzhen (
 SHE:000786.)17 China Datang Corp Renewable Power Co Ltd WIND HKSE (
 HKG:1798)18 Shanghai Aero Auto Electromechanical SOLAR Shanghai (
 SHA:600151)19 JA Solar Holdings SOLAR NASDAQ (
 NASDAQ:JASO)20 Beijing Water Business Doctor Co., Ltd. WATER Shenzhen (
 SHE:300055)
About Sino CleanTech
 Sino CleanTech publishes the China CleanTech Index and facilitates Chinese Cleantech investments and provides services to Government agencies across Asia to help stimulate investment in the Cleantech industry. These investments include looking at listed cleantech stocks and direct investment into projects and companies. Sino Cleantech is active in facilitating:
- Investment from Chinese investors into cleantech in both China and internationally; and
- Investment from international investors into the Chinese cleantech market.
Please contact us if you are looking for funding or seeking investments.
| ||
|


