Foshan Electrical and Lighting Co Ltd
SHE:000541 ISIN:CNE000000DN3

News
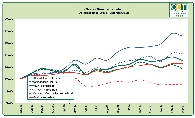
The China CleanTech Index underperformed two of its four benchmarks for the month of August 2015 and recorded a loss of 10.3%. This was driven by big losses across all Chinese stocks due to the volatile Shanghai stock exchange.
With over 160 companies falling under the coverage of the Index and with a combined market capitalisation of over 2.2 trillion Renminbi (US$370 billion), the China CleanTech Index presents a picture of the Chinese cleantech industry's growth in a single measure.
The best performing sub-indices for the month were the China Efficiency Index with a 13.0% gain and the China Storage Index with an 11.6% gain. The two weakest sub-indices through August were the China Waste Index which recorded a gain of only 4.5% and the China Water Index recording a gain of 5.5%.
The China CleanTech Index provides the April-June 2014 quarterly performance report. It includes: China CleanTech Index overview, China CleanTech Index performance, component sub-indicies and index component companies.
The China CleanTech Index underperformed all of its four benchmarks for the month of March 2014 and recorded a loss of 4.5%. The China CleanTech Index fell from 46.8 to 44.7 over the month of March recording a 4.5% loss. This compared to the NEX loss of 2.5%, the CTIUS loss of 0.9%, the Shanghai Composite loss of 1.1% and the MSCI loss of 0.1%. The China CleanTech 20 fared worse with a loss of 5.7%.
The China CleanTech Index underperformed all of its four benchmarks for the month of March 2014 and recorded a loss of 4.5%. The China CleanTech Index fell from 46.8 to 44.7 over the month of March recording a 4.5% loss. This compared to the NEX loss of 2.5%, the CTIUS loss of 0.9%, the Shanghai Composite loss of 1.1% and the MSCI loss of 0.1%. The China CleanTech 20 fared worse with a loss of 5.7%.
The China CleanTech Index rose from 44.37 to 44.93 over the month of January recording a 1.3% gain. This compared to the NEX gain of 3%, the CTIUS loss of 5.8%, the Shanghai Composite loss of 3.9% and the MSCI loss of 3.8%.
43,249 COMPANY PROFILE VIEWS
- This Page Viewed: (Last 7 Days: 47) (Last 30 Days: 168) (Since Published: 14220)


