Solar Recovery Continues to Drive Index Growth
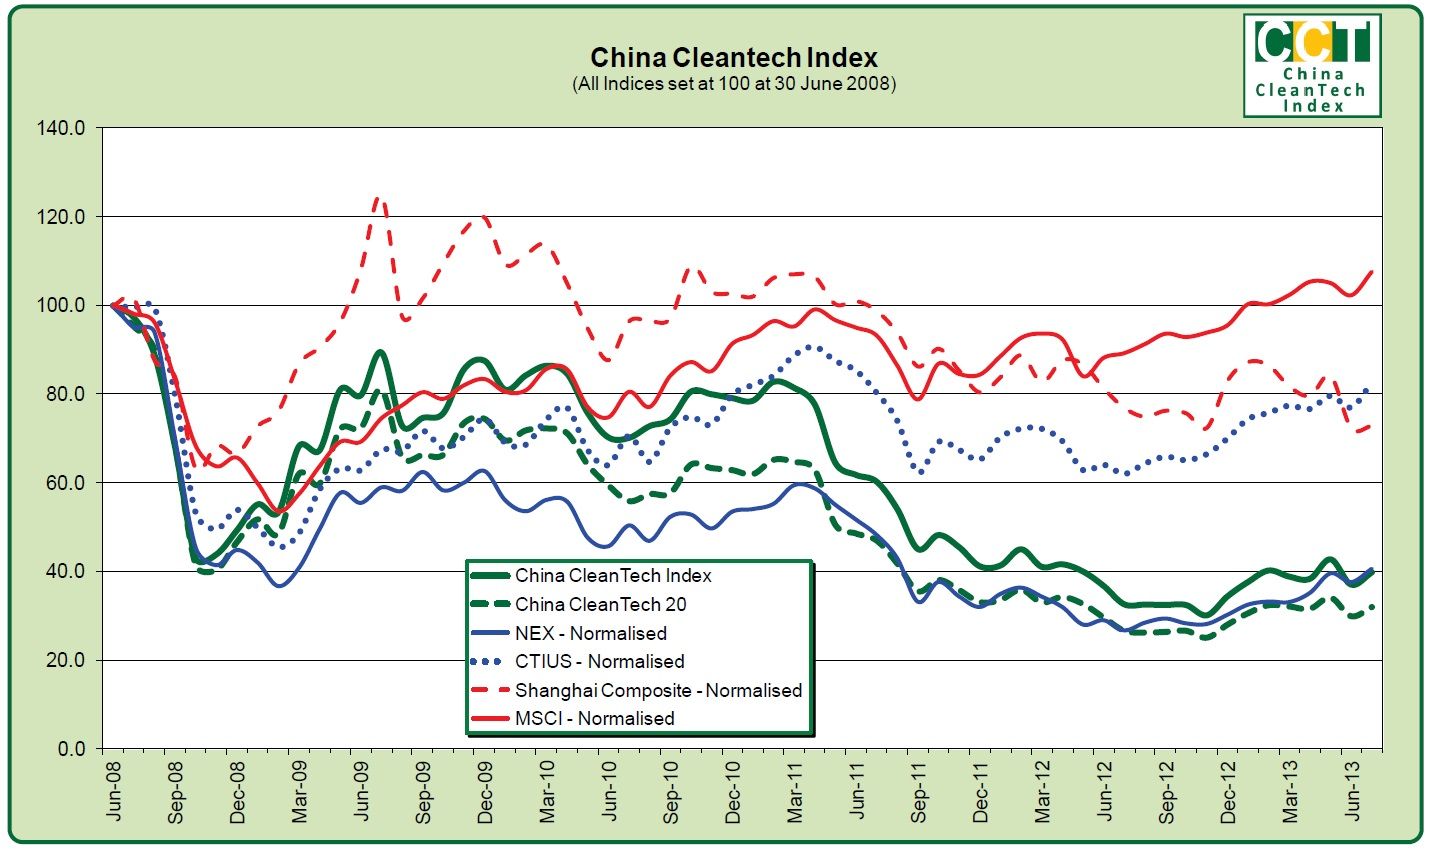
Sydney, Aug 5, 2013 AEST (ABN Newswire) - The China CleanTech Index rose strongly in July 2013 to resume its strong performance from earlier in 2013. Over the month, the Index outperformed all but one of its four benchmarks.
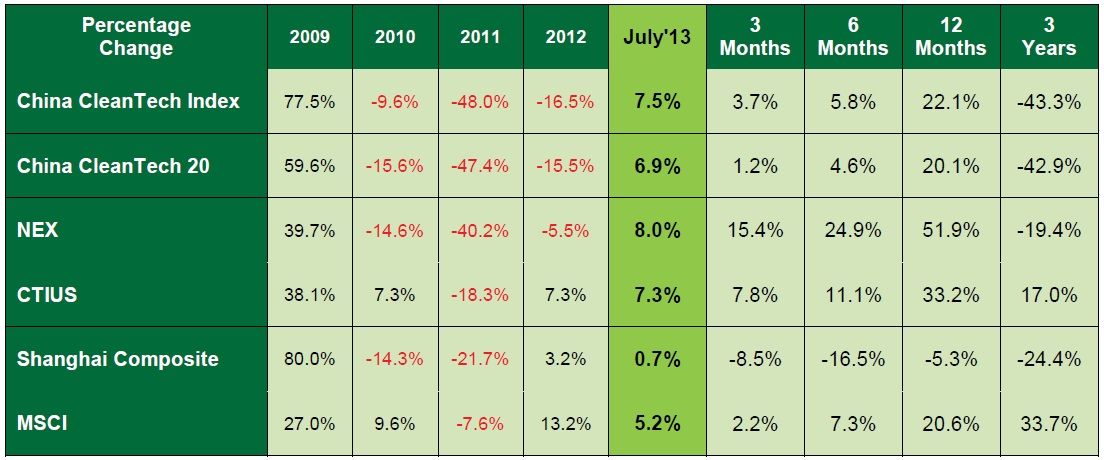
The China CleanTech Index rose from 37.0 to 39.8 over the month of July recording a 7.5% gain. This compared to the NEX gain of 8.0%, the CTIUS gain of 7.3%, the Shanghai Composite gain of only 0.7% and the MSCI gain of 5.2%.
The China CleanTech 20 also recorded a good gain for the month of 6.9% although behind the wider Index showing that there is strong growth amongst some of the smaller stocks in the Index.
The Index performance for the last 12 months shows a gain of 22.1%, which is ahead of the Shanghai Composite and the MSCI but lagging the global cleantech related indices.
The best performing sub-indices for the month were the China Solar Index which continued its recovery with a 15.5% gain and the China Storage Index with a 14.3% gain. As shown overleaf, of the 14 stocks that recorded gains of more than 30% over the month, eight of these were solar companies. The two weakest sub-indices through July were the China Hydro Index which recorded a gain of only 0.3% and the China Efficiency Index recording a gain of 3.5%.
--------------------------------------------------------Percentage Change 2009 2010 2011 2012 --------------------------------------------------------China CleanTech Index 77.5% -9.6% -48.0% -16.5% China CleanTech 20 59.6% -15.6% -47.4% -15.5% NEX 39.7% -14.6% -40.2% -5.5% CTIUS 38.1% 7.3% -18.3% 7.3% Shanghai Composite 80.0% -14.3% -21.7% 3.2% MSCI 27.0% 9.6% -7.6% 13.2% ----------------------------------------------------------------------------------------------------------------Percentage Change JUL'13 3 Mths 6 Mths 12 Mths 3 Yrs--------------------------------------------------------China CleanTech Index 7.5% 3.7% 5.8% 22.1% -43.3%China CleanTech 20 6.9% 1.2% 4.6% 20.1% -42.9%NEX 8.0% 15.4% 24.9% 51.9% -19.4%CTIUS 7.3% 7.8% 11.1% 33.2% 17.0%Shanghai Composite 0.7% -8.5% -16.5% -5.3% -24.4%MSCI 5.2% 2.2% 7.3% 20.6% 33.7%--------------------------------------------------------
The market capitalisation of the 150 stocks in the China CleanTech Index is CNY 872 billion, falling from its peak of CNY 911 billion in February 2011 but up a long way from its trough of CNY 604 billion in November 2012.
The month's performance was driven by 14 companies having share price gains of more than 30%. The greatest percentage gains were recorded by China Recycling Energy Corp. (CREG), ReneSola (SOL) and Hanwha Solarone (HSOL).
These were partially offset by losses from other companies with 8 companies having losses of more than 20%. The greatest percentage losses were recorded by CNPV Solar Power SA (ALCNP.PA), SmartHeat Inc (HEAT) and Bodisen Biotech, Inc. (BBCZ).
These best and worst performers are shown in the table below.
July 2013
Best Performers - Share Price Gain > 30%
China Clean Energy Inc. ( CCGY:OTCMKTS)
Canadian Solar Inc (NASDAQ:CSIQ)
China Solar Energy Holdings Limited (HKG:0155)
China Sunergy (NASDAQ:CSUN)
Hanwha Solarone Co Ltd (NASDAQ:HSOL)
JinkoSolar Holding Co., Ltd. (NYSE:JKS)
ReneSola Ltd. (NYSE:SOL)
Shunfeng Photovoltaic International (HKG:1165)
Suntech Power Holdings (NYSE:STP)
Chaowei Power Holdings Limited (HKG:0951)
China BAK Battery (NASDAQ:CBAK)
China Recycling Energy Corp. (NASDAQ:CREG)
Nanjing CEC Environmental Protection Co., Ltd (SHE:300172)
CleanTech Innovations Inc. (CTEK:OTCMKTS)
Worst Performers - Share Price Loss > 20%
HC Semitek (SHE:300323)
SmartHeat Inc (HEAT:OTCMKTS)
Bodisen Biotech, Inc. (LON:BODI)
Hebei Sailhero Environmental Protection High-tech Co.,Ltd (SHE:300137)
China Solar & Clean Energy Solns., Inc. (CSOL:OTCMKTS)
CNPV Solar Power SA (ALCNP:FRA)
China Sun Group High Tech Co. (CSGH:OTCMKTS)
China Hydroelectric Corporation (NYSE:CHC)
The China Cleantech Index is updated each month and published on the SinoCleantech website at www.sinocleantech.com. It is published internationally in conjunction with Cleantech Investor (www.cleantechinvestor.com) and in China in conjunction with Top Capital (www.topcapital.cn).
Monthly results can be emailed directly to interested parties by signing up to the distribution list at:
http://www.sinocleantech.com/e/cleantech_index.html
About Sino CleanTech
 Sino CleanTech publishes the China CleanTech Index and facilitates Chinese Cleantech investments and provides services to Government agencies across Asia to help stimulate investment in the Cleantech industry. These investments include looking at listed cleantech stocks and direct investment into projects and companies. Sino Cleantech is active in facilitating:
- Investment from Chinese investors into cleantech in both China and internationally; and
- Investment from international investors into the Chinese cleantech market.
Please contact us if you are looking for funding or seeking investments.
![]()
| ||
|
Suntech Power Holdings Co., Ltd. 


SmartHeat Inc.
Sino CleanTech
Shunfeng Photovoltaic International Ltd
ReneSola Ltd
Nanjing CEC Environmental Protection Co., Ltd
JinkoSolar Holding Co., Ltd 
Hebei Sailhero Environmental Protection High-tech Co.,Ltd
HC SemiTek Corp
Hanwha Solarone Co,. Ltd
Dongying Photovoltaic Power Co Ltd
Cleantech Innovations, Inc.
China Sunergy Co Ltd
China Sun Group High Tech Co
China Solar Energy Holdings Limited
China Solar & Clean Energy Solns., Inc.
China Recycling Energy Corp.
China Hydroelectric Corporation
China Clean Energy Inc.
China BAK Battery
Chaowei Power Holdings Limited
Canadian Solar Inc.
Bodisen Biotech Inc
SmartHeat Inc.
Sino CleanTech
Shunfeng Photovoltaic International Ltd
ReneSola Ltd
Nanjing CEC Environmental Protection Co., Ltd
JinkoSolar Holding Co., Ltd
Hebei Sailhero Environmental Protection High-tech Co.,Ltd
HC SemiTek Corp
Hanwha Solarone Co,. Ltd
Dongying Photovoltaic Power Co Ltd
Cleantech Innovations, Inc.
China Sunergy Co Ltd
China Sun Group High Tech Co
China Solar Energy Holdings Limited
China Solar & Clean Energy Solns., Inc.
China Recycling Energy Corp.
China Hydroelectric Corporation
China Clean Energy Inc.
China BAK Battery
Chaowei Power Holdings Limited
Canadian Solar Inc.
Bodisen Biotech Inc